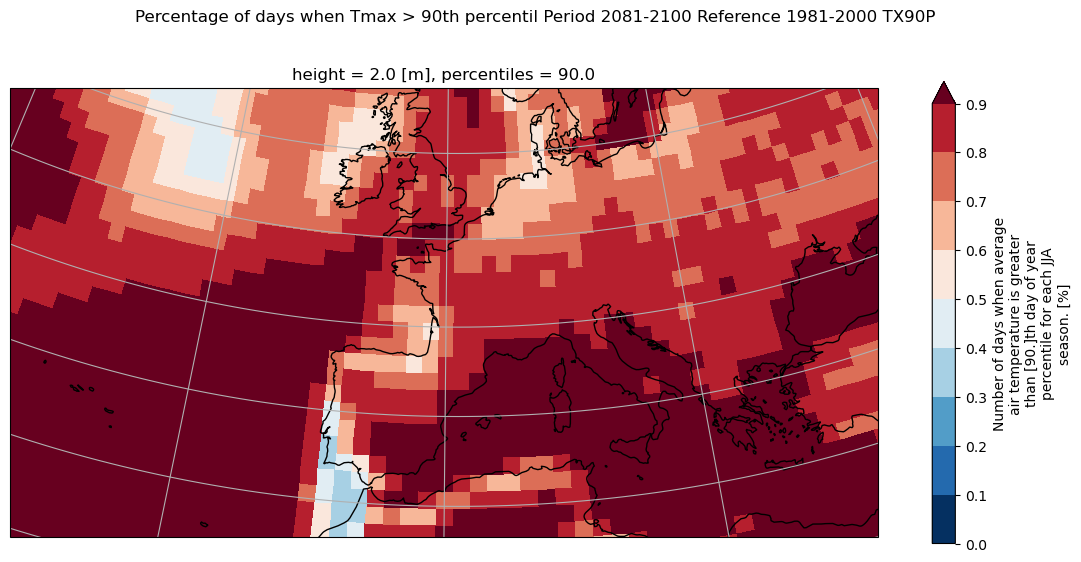
Calculate percentage of days when Tmean > 90th percentile (TG90p)#
Example notebook that runs icclim.
The example calculates the percentage of days when Tas > 90th percentile (TG90pindicator) for the dataset chosen by the user on C4I.
We assume to have the tas variable in netCDF files in a
./data folder for model CMCC and for one member r1i1p1f1.The data can be dowloaded using the metalink provided with this notebook. The data described in a
.metalink file can be dowloaded with tools such as aria2 or a browser plugin such as DownThemAll! If you wish to use a different dataset, you can use the climate 4 impact portal to search and select the data you wish to
use and a metalink file to the ESGF data will be provided.The data is read using xarray and a plot of the time series over a specific region is generated, as well as an average spatial map. Several output types examples are shown.
The dataset that is expected for this notebook are tas parameter (needed to calculate the TG90p indicator) for one specific climate model and experiment as well as one member. The time period should be continuous.
The following time period is considered: 2081-01-01 to 2100-12-31 using the period 1981-01-01 to 2000-12-31 as a reference. Plots are shown over European region.
Install packages#
[1]:
%pip install icclim matplotlib nc_time_axis
Requirement already satisfied: icclim in /home/bzah/micromamba/envs/icclim-dev/lib/python3.11/site-packages (6.6.0)
Requirement already satisfied: matplotlib in /home/bzah/micromamba/envs/icclim-dev/lib/python3.11/site-packages (3.8.2)
Requirement already satisfied: nc_time_axis in /home/bzah/micromamba/envs/icclim-dev/lib/python3.11/site-packages (1.4.1)
Requirement already satisfied: numpy>=1.16 in /home/bzah/micromamba/envs/icclim-dev/lib/python3.11/site-packages (from icclim) (1.26.2)
Requirement already satisfied: xarray>=2022.6 in /home/bzah/micromamba/envs/icclim-dev/lib/python3.11/site-packages (from icclim) (2023.10.1)
Requirement already satisfied: xclim<=0.47,>=0.45 in /home/bzah/micromamba/envs/icclim-dev/lib/python3.11/site-packages (from icclim) (0.47.0)
Requirement already satisfied: cf_xarray>=0.7.4 in /home/bzah/micromamba/envs/icclim-dev/lib/python3.11/site-packages (from icclim) (0.8.6)
Requirement already satisfied: cftime>=1.4.1 in /home/bzah/micromamba/envs/icclim-dev/lib/python3.11/site-packages (from icclim) (1.6.3)
Requirement already satisfied: dask[array] in /home/bzah/micromamba/envs/icclim-dev/lib/python3.11/site-packages (from icclim) (2023.12.1)
Requirement already satisfied: netCDF4>=1.5.7 in /home/bzah/micromamba/envs/icclim-dev/lib/python3.11/site-packages (from icclim) (1.6.5)
Requirement already satisfied: psutil in /home/bzah/micromamba/envs/icclim-dev/lib/python3.11/site-packages (from icclim) (5.9.7)
Requirement already satisfied: zarr in /home/bzah/micromamba/envs/icclim-dev/lib/python3.11/site-packages (from icclim) (2.16.1)
Requirement already satisfied: rechunker!=0.4,>=0.3 in /home/bzah/micromamba/envs/icclim-dev/lib/python3.11/site-packages (from icclim) (0.5.2)
Requirement already satisfied: fsspec in /home/bzah/micromamba/envs/icclim-dev/lib/python3.11/site-packages (from icclim) (2023.12.2)
Requirement already satisfied: pandas>=1.3 in /home/bzah/micromamba/envs/icclim-dev/lib/python3.11/site-packages (from icclim) (2.1.4)
Requirement already satisfied: dateparser in /home/bzah/micromamba/envs/icclim-dev/lib/python3.11/site-packages (from icclim) (1.2.0)
Requirement already satisfied: pint in /home/bzah/micromamba/envs/icclim-dev/lib/python3.11/site-packages (from icclim) (0.19.2)
Requirement already satisfied: jinja2 in /home/bzah/micromamba/envs/icclim-dev/lib/python3.11/site-packages (from icclim) (3.1.2)
Requirement already satisfied: contourpy>=1.0.1 in /home/bzah/micromamba/envs/icclim-dev/lib/python3.11/site-packages (from matplotlib) (1.2.0)
Requirement already satisfied: cycler>=0.10 in /home/bzah/micromamba/envs/icclim-dev/lib/python3.11/site-packages (from matplotlib) (0.12.1)
Requirement already satisfied: fonttools>=4.22.0 in /home/bzah/micromamba/envs/icclim-dev/lib/python3.11/site-packages (from matplotlib) (4.46.0)
Requirement already satisfied: kiwisolver>=1.3.1 in /home/bzah/micromamba/envs/icclim-dev/lib/python3.11/site-packages (from matplotlib) (1.4.5)
Requirement already satisfied: packaging>=20.0 in /home/bzah/micromamba/envs/icclim-dev/lib/python3.11/site-packages (from matplotlib) (23.2)
Requirement already satisfied: pillow>=8 in /home/bzah/micromamba/envs/icclim-dev/lib/python3.11/site-packages (from matplotlib) (10.1.0)
Requirement already satisfied: pyparsing>=2.3.1 in /home/bzah/micromamba/envs/icclim-dev/lib/python3.11/site-packages (from matplotlib) (3.1.1)
Requirement already satisfied: python-dateutil>=2.7 in /home/bzah/micromamba/envs/icclim-dev/lib/python3.11/site-packages (from matplotlib) (2.8.2)
Requirement already satisfied: certifi in /home/bzah/micromamba/envs/icclim-dev/lib/python3.11/site-packages (from netCDF4>=1.5.7->icclim) (2023.11.17)
Requirement already satisfied: pytz>=2020.1 in /home/bzah/micromamba/envs/icclim-dev/lib/python3.11/site-packages (from pandas>=1.3->icclim) (2023.3.post1)
Requirement already satisfied: tzdata>=2022.1 in /home/bzah/micromamba/envs/icclim-dev/lib/python3.11/site-packages (from pandas>=1.3->icclim) (2023.3)
Requirement already satisfied: six>=1.5 in /home/bzah/micromamba/envs/icclim-dev/lib/python3.11/site-packages (from python-dateutil>=2.7->matplotlib) (1.16.0)
Requirement already satisfied: mypy-extensions in /home/bzah/micromamba/envs/icclim-dev/lib/python3.11/site-packages (from rechunker!=0.4,>=0.3->icclim) (1.0.0)
Requirement already satisfied: boltons>=20.1 in /home/bzah/micromamba/envs/icclim-dev/lib/python3.11/site-packages (from xclim<=0.47,>=0.45->icclim) (23.0.0)
Requirement already satisfied: bottleneck>=1.3.1 in /home/bzah/micromamba/envs/icclim-dev/lib/python3.11/site-packages (from xclim<=0.47,>=0.45->icclim) (1.3.7)
Requirement already satisfied: Click>=8.1 in /home/bzah/micromamba/envs/icclim-dev/lib/python3.11/site-packages (from xclim<=0.47,>=0.45->icclim) (8.1.7)
Requirement already satisfied: jsonpickle in /home/bzah/micromamba/envs/icclim-dev/lib/python3.11/site-packages (from xclim<=0.47,>=0.45->icclim) (3.0.2)
Requirement already satisfied: lmoments3>=1.0.5 in /home/bzah/micromamba/envs/icclim-dev/lib/python3.11/site-packages (from xclim<=0.47,>=0.45->icclim) (1.0.6)
Requirement already satisfied: numba in /home/bzah/micromamba/envs/icclim-dev/lib/python3.11/site-packages (from xclim<=0.47,>=0.45->icclim) (0.58.1)
Requirement already satisfied: pyyaml in /home/bzah/micromamba/envs/icclim-dev/lib/python3.11/site-packages (from xclim<=0.47,>=0.45->icclim) (6.0.1)
Requirement already satisfied: scikit-learn>=0.21.3 in /home/bzah/micromamba/envs/icclim-dev/lib/python3.11/site-packages (from xclim<=0.47,>=0.45->icclim) (1.3.2)
Requirement already satisfied: scipy>=1.2 in /home/bzah/micromamba/envs/icclim-dev/lib/python3.11/site-packages (from xclim<=0.47,>=0.45->icclim) (1.11.4)
Requirement already satisfied: statsmodels in /home/bzah/micromamba/envs/icclim-dev/lib/python3.11/site-packages (from xclim<=0.47,>=0.45->icclim) (0.14.1)
Requirement already satisfied: cloudpickle>=1.5.0 in /home/bzah/micromamba/envs/icclim-dev/lib/python3.11/site-packages (from dask[array]->icclim) (3.0.0)
Requirement already satisfied: partd>=1.2.0 in /home/bzah/micromamba/envs/icclim-dev/lib/python3.11/site-packages (from dask[array]->icclim) (1.4.1)
Requirement already satisfied: toolz>=0.10.0 in /home/bzah/micromamba/envs/icclim-dev/lib/python3.11/site-packages (from dask[array]->icclim) (0.12.0)
Requirement already satisfied: importlib-metadata>=4.13.0 in /home/bzah/micromamba/envs/icclim-dev/lib/python3.11/site-packages (from dask[array]->icclim) (7.0.0)
Requirement already satisfied: asciitree in /home/bzah/micromamba/envs/icclim-dev/lib/python3.11/site-packages (from zarr->icclim) (0.3.3)
Requirement already satisfied: fasteners in /home/bzah/micromamba/envs/icclim-dev/lib/python3.11/site-packages (from zarr->icclim) (0.17.3)
Requirement already satisfied: numcodecs>=0.10.0 in /home/bzah/micromamba/envs/icclim-dev/lib/python3.11/site-packages (from zarr->icclim) (0.12.1)
Requirement already satisfied: regex!=2019.02.19,!=2021.8.27 in /home/bzah/micromamba/envs/icclim-dev/lib/python3.11/site-packages (from dateparser->icclim) (2023.10.3)
Requirement already satisfied: tzlocal in /home/bzah/micromamba/envs/icclim-dev/lib/python3.11/site-packages (from dateparser->icclim) (5.2)
Requirement already satisfied: MarkupSafe>=2.0 in /home/bzah/micromamba/envs/icclim-dev/lib/python3.11/site-packages (from jinja2->icclim) (2.1.3)
Requirement already satisfied: zipp>=0.5 in /home/bzah/micromamba/envs/icclim-dev/lib/python3.11/site-packages (from importlib-metadata>=4.13.0->dask[array]->icclim) (3.17.0)
Requirement already satisfied: locket in /home/bzah/micromamba/envs/icclim-dev/lib/python3.11/site-packages (from partd>=1.2.0->dask[array]->icclim) (1.0.0)
Requirement already satisfied: joblib>=1.1.1 in /home/bzah/micromamba/envs/icclim-dev/lib/python3.11/site-packages (from scikit-learn>=0.21.3->xclim<=0.47,>=0.45->icclim) (1.3.2)
Requirement already satisfied: threadpoolctl>=2.0.0 in /home/bzah/micromamba/envs/icclim-dev/lib/python3.11/site-packages (from scikit-learn>=0.21.3->xclim<=0.47,>=0.45->icclim) (3.2.0)
Requirement already satisfied: bokeh>=2.4.2 in /home/bzah/micromamba/envs/icclim-dev/lib/python3.11/site-packages (from dask[array,diagnostics]->rechunker!=0.4,>=0.3->icclim) (3.3.2)
Requirement already satisfied: llvmlite<0.42,>=0.41.0dev0 in /home/bzah/micromamba/envs/icclim-dev/lib/python3.11/site-packages (from numba->xclim<=0.47,>=0.45->icclim) (0.41.1)
Requirement already satisfied: patsy>=0.5.4 in /home/bzah/micromamba/envs/icclim-dev/lib/python3.11/site-packages (from statsmodels->xclim<=0.47,>=0.45->icclim) (0.5.4)
Requirement already satisfied: tornado>=5.1 in /home/bzah/micromamba/envs/icclim-dev/lib/python3.11/site-packages (from bokeh>=2.4.2->dask[array,diagnostics]->rechunker!=0.4,>=0.3->icclim) (6.3.3)
Requirement already satisfied: xyzservices>=2021.09.1 in /home/bzah/micromamba/envs/icclim-dev/lib/python3.11/site-packages (from bokeh>=2.4.2->dask[array,diagnostics]->rechunker!=0.4,>=0.3->icclim) (2023.10.1)
Note: you may need to restart the kernel to use updated packages.
[2]:
import datetime
import sys
from pathlib import Path

import cartopy.crs as ccrs
import cftime
import dask
import icclim
import matplotlib.pyplot as plt
import numpy as np
import pandas as pd
import xarray as xr

print("python: ", sys.version)
print("numpy: ", np.__version__)
print("pandas: ", pd.__version__)


import xclim

print("xclim: ", xclim.__version__)
print("dask: ", dask.__version__)
print("xarray: ", xr.__version__)
print("icclim: ", icclim.__version__)
print("cftime: ", cftime.__version__)
python:  3.11.7 | packaged by conda-forge | (main, Dec 15 2023, 08:38:37) [GCC 12.3.0]
numpy:  1.26.2
pandas:  2.1.4
xclim:  0.47.0
dask:  2023.12.1
xarray:  2023.10.1
icclim:  6.6.0
cftime:  1.6.3
Specification of index parameters#
[5]:
# studied period
dt1 = datetime.datetime(2081, 1, 1, tzinfo=datetime.timezone.utc)
dt2 = datetime.datetime(2100, 12, 31, tzinfo=datetime.timezone.utc)

# reference period
dt1r = datetime.datetime(1981, 1, 1, tzinfo=datetime.timezone.utc)
dt2r = datetime.datetime(2000, 12, 31, tzinfo=datetime.timezone.utc)

out_f = "tg90p_icclim.nc"
data_dir = Path("data")
filenames = [str(f) for f in data_dir.glob("tas_day_CMCC-ESM2*.nc")]
filenames
[5]:
['data/tas_day_CMCC-ESM2_historical_r1i1p1f1_gn_19250101-19491231.nc',
 'data/tas_day_CMCC-ESM2_historical_r1i1p1f1_gn_19500101-19741231.nc',
 'data/tas_day_CMCC-ESM2_historical_r1i1p1f1_gn_19750101-19991231.nc',
 'data/tas_day_CMCC-ESM2_ssp585_r1i1p1f1_gn_20900101-21001231.nc',
 'data/tas_day_CMCC-ESM2_historical_r1i1p1f1_gn_20000101-20141231.nc',
 'data/tas_day_CMCC-ESM2_historical_r1i1p1f1_gn_19000101-19241231.nc',
 'data/tas_day_CMCC-ESM2_ssp585_r1i1p1f1_gn_20400101-20641231.nc',
 'data/tas_day_CMCC-ESM2_ssp585_r1i1p1f1_gn_20650101-20891231.nc',
 'data/tas_day_CMCC-ESM2_historical_r1i1p1f1_gn_18500101-18741231.nc',
 'data/tas_day_CMCC-ESM2_ssp585_r1i1p1f1_gn_20150101-20391231.nc',
 'data/tas_day_CMCC-ESM2_historical_r1i1p1f1_gn_18750101-18991231.nc']
[6]:
icclim.index(
    index_name="TG90p",
    in_files=filenames,
    slice_mode="JJA",
    base_period_time_range=[dt1r, dt2r],
    time_range=[dt1, dt2],
    out_unit="%",
    out_file=out_f,
    logs_verbosity="HIGH",
)
2024-01-19 15:27:59,669    ********************************************************************************************
2024-01-19 15:27:59,671    *                                                                                          *
2024-01-19 15:27:59,672    *          icclim                6.6.0   *
2024-01-19 15:27:59,672    *                                                                                          *
2024-01-19 15:27:59,673    *                                                                                          *
2024-01-19 15:27:59,674    *          Fri Jan 19 14:27:59 2024                                                    *
2024-01-19 15:27:59,674    *                                                                                          *
2024-01-19 15:27:59,674    *          BEGIN EXECUTION                                                                 *
2024-01-19 15:27:59,675    *                                                                                          *
2024-01-19 15:27:59,675    ********************************************************************************************
2024-01-19 15:27:59,676 Processing: 0%
/home/bzah/workspace/cerfacs/icclim/src/icclim/generic_indices/generic_indicators.py:1319: UserWarning: Unable to infer the frequency of the time series. To mute this, set xclim's option data_validation='log'.
  check_freq(da, src_freq, strict=True)
/home/bzah/micromamba/envs/icclim-dev/lib/python3.11/site-packages/xclim/core/cfchecks.py:41: UserWarning: Variable does not have a `cell_methods` attribute.
  _check_cell_methods(
/home/bzah/micromamba/envs/icclim-dev/lib/python3.11/site-packages/xclim/core/cfchecks.py:45: UserWarning: Variable does not have a `standard_name` attribute.
  check_valid(vardata, "standard_name", data["standard_name"])
/home/bzah/micromamba/envs/icclim-dev/lib/python3.11/site-packages/distributed/client.py:3162: UserWarning: Sending large graph of size 108.75 MiB.
This may cause some slowdown.
Consider scattering data ahead of time and using futures.
  warnings.warn(
2024-01-19 15:31:24,920 Processing: 100%
2024-01-19 15:31:24,927    ********************************************************************************************
2024-01-19 15:31:24,930    *                                                                                          *
2024-01-19 15:31:24,931    *          icclim                6.6.0   *
2024-01-19 15:31:24,931    *                                                                                          *
2024-01-19 15:31:24,932    *                                                                                          *
2024-01-19 15:31:24,933    *          Fri Jan 19 14:31:24 2024                                                    *
2024-01-19 15:31:24,934    *                                                                                          *
2024-01-19 15:31:24,935    *          END EXECUTION                                                                   *
2024-01-19 15:31:24,936    *                                                                                          *
2024-01-19 15:31:24,936    *          CP SECS = 63.326623434                                                            *
2024-01-19 15:31:24,937    *                                                                                          *
2024-01-19 15:31:24,949    ********************************************************************************************
[6]:
<xarray.Dataset>
Dimensions:      (lat: 192, lon: 288, time: 20, bounds: 2)
Coordinates:
  * lat          (lat) float64 -90.0 -89.06 -88.12 -87.17 ... 88.12 89.06 90.0
  * lon          (lon) float64 0.0 1.25 2.5 3.75 5.0 ... 355.0 356.2 357.5 358.8
    height       float64 2.0
    percentiles  float64 90.0
  * time         (time) object 2081-07-16 12:00:00 ... 2100-07-16 12:00:00
  * bounds       (bounds) int64 0 1
Data variables:
    TG90p        (time, lat, lon) float64 dask.array<chunksize=(1, 192, 255), meta=np.ndarray>
    time_bounds  (time, bounds) object 2081-06-01 00:00:00 ... 2100-08-31 00:...
Attributes:
    title:        number_of_days_when_average_air_temperature_is_greater_than...
    references:   ATBD of the ECA&D indices calculation (https://knmi-ecad-as...
    institution:  Climate impact portal (https://climate4impact.eu)
    history:      2020-12-21T16:22:42Z altered by CMOR: Treated scalar dimens...
    source:
Conventions: CF-1.6Plot preparation#
[7]:
with xr.open_dataset(out_f, decode_times=False) as ds:
    tg90_xr = ds
    ds["time"] = xr.decode_cf(ds).time

# Select a single x,y combination from the data
longitude = tg90_xr["TG90p"]["lon"].sel(lon=3.5, method="nearest")
latitude = tg90_xr["TG90p"]["lat"].sel(lat=44.2, method="nearest")

print("Long, Lat values:", longitude, latitude)
Long, Lat values: <xarray.DataArray 'lon' ()>
array(3.75)
Coordinates:
    lon          float64 3.75
    height       float64 ...
    percentiles  float64 ...
Attributes:
    long_name:      Longitude
    axis:           X
    standard_name:  longitude
    bounds:         lon_bnds
    units:          degrees_east <xarray.DataArray 'lat' ()>
array(43.82198953)
Coordinates:
    lat          float64 43.82
    height       float64 ...
    percentiles  float64 ...
Attributes:
    bounds:         lat_bnds
    units:          degrees_north
    axis:           Y
    long_name:      Latitude
    standard_name:  latitude
Subset and Plot#
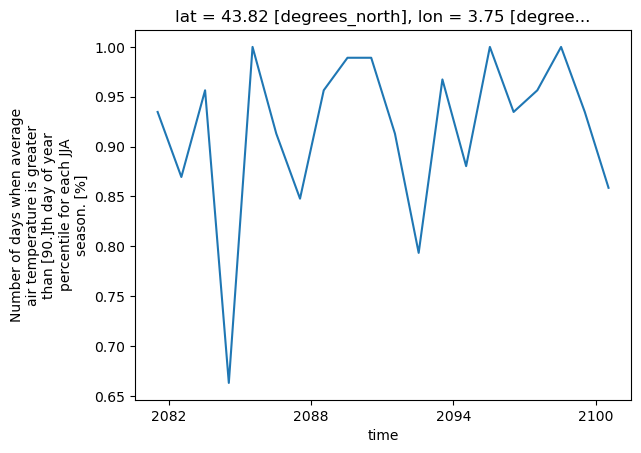
[8]:
# Slice the data spatially using a single lat/lon point
one_point = tg90_xr["TG90p"].sel(lat=latitude, lon=longitude)
print(one_point)
# Use xarray to create a quick time series plot
one_point.plot.line()
plt.show()
<xarray.DataArray 'TG90p' (time: 20)>
[20 values with dtype=float64]
Coordinates:
    lat          float64 43.82
    lon          float64 3.75
    height       float64 ...
    percentiles  float64 ...
  * time         (time) object 2081-07-16 12:00:00 ... 2100-07-16 12:00:00
Attributes:
    long_name:      Number of days when average air temperature is greater th...
    original_name:  TREFHT
    standard_name:  number_of_days_when_average_air_temperature_is_greater_th...
    cell_measures:  area: areacella
    cell_methods:   time: sum over days
    comment:        near-surface (usually, 2 meter) air temperature
    units:          %
    history:
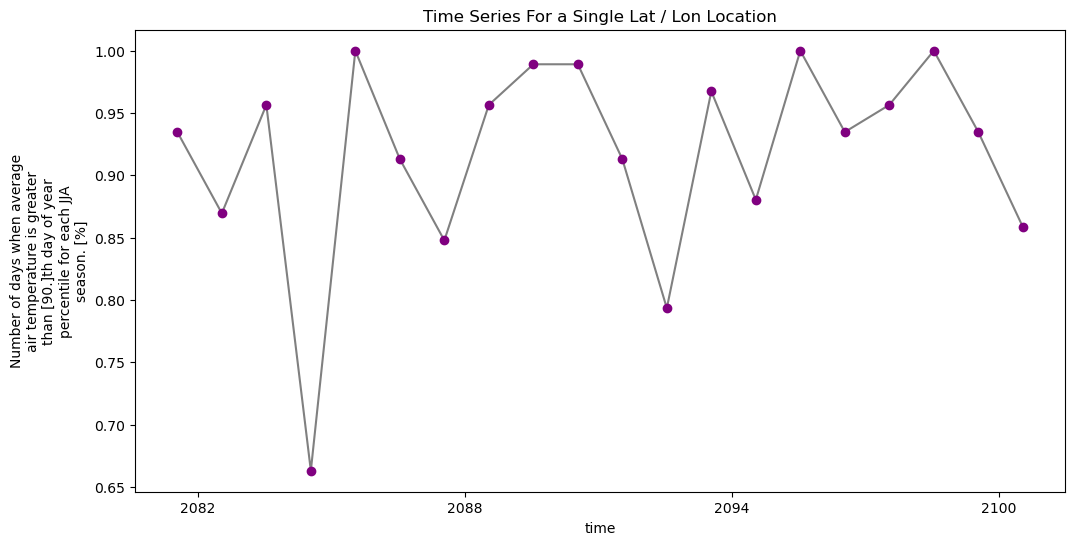
[9]:
# You can clean up your plot as you wish using standard matplotlib approaches
f, ax = plt.subplots(figsize=(12, 6))
one_point.plot.line(
    hue="lat",
    marker="o",
    ax=ax,
    color="grey",
    markerfacecolor="purple",
    markeredgecolor="purple",
)
ax.set(title="Time Series For a Single Lat / Lon Location")

# Uncomment the line below if you wish to export the figure as a .png file
# plt.savefig("single_point_timeseries.png")
plt.show()
[10]:
# Convert to dataframe -- then this can easily be exported to a csv
one_point_df = one_point.to_dataframe()
# View just the first 5 rows of the data
one_point_df.head()

# Export data to .csv file
# one_point_df.to_csv("one-location.csv")
[10]:
| lat | lon | height | percentiles | TG90p | |
|---|---|---|---|---|---|
| time | |||||
| 2081-07-16 12:00:00 | 43.82199 | 3.75 | 2.0 | 90.0 | 0.934783 |
| 2082-07-16 12:00:00 | 43.82199 | 3.75 | 2.0 | 90.0 | 0.869565 |
| 2083-07-16 12:00:00 | 43.82199 | 3.75 | 2.0 | 90.0 | 0.956522 |
| 2084-07-16 12:00:00 | 43.82199 | 3.75 | 2.0 | 90.0 | 0.663043 |
| 2085-07-16 12:00:00 | 43.82199 | 3.75 | 2.0 | 90.0 | 1.000000 |
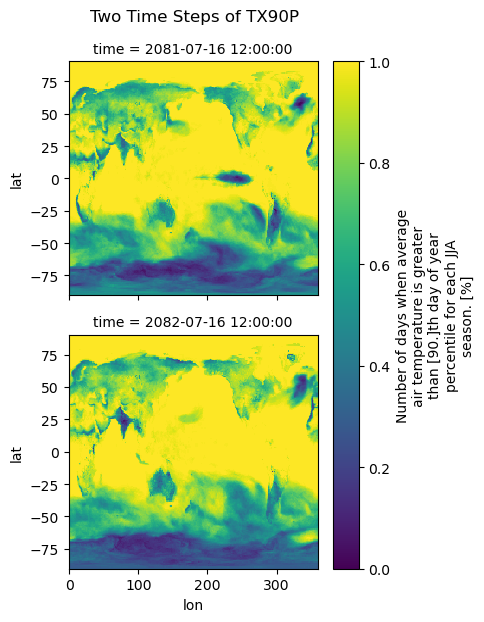
[11]:
# Time subsetting: this is just an example on how to do it
start_date = "2081-01-01"
end_date = "2082-12-31"

tg90_two = tg90_xr["TG90p"].sel(time=slice(start_date, end_date))
[12]:
# Quickly plot the data using xarray.plot()
tg90_two.plot(x="lon", y="lat", col="time", col_wrap=1)

plt.suptitle("Two Time Steps of TG90P", y=1.03)
plt.show()
[13]:
# Set spatial extent and centre
central_lat = 47.0
central_lon = 1.0
extent = [-30, 30, 30, 56]  # Western Europe

tg90 = tg90_xr["TG90p"]

# Calculate time average
tg90_avg = tg90.mean(dim="time", keep_attrs=True)

# Set plot projection
map_proj = ccrs.AlbersEqualArea(
    central_longitude=central_lon, central_latitude=central_lat
)

# Define plot
f, ax = plt.subplots(figsize=(14, 6), subplot_kw={"projection": map_proj})

# Plot data with proper colormap scale range
levels = np.arange(0, 1.0, 0.1)
p = tg90_avg.plot(levels=levels, cmap="RdBu_r", transform=ccrs.PlateCarree())

# Plot information
plt.suptitle(
    "Percentage of days when Tas > 90th percentil Period 2081-2100 Reference 1981-2000 TG90P",
    y=1,
)

# Add the coastlines to axis and set extent
ax.coastlines()
ax.gridlines()
ax.set_extent(extent)

# Save plot as png
plt.savefig("c4i_tg90p_icclim.png")
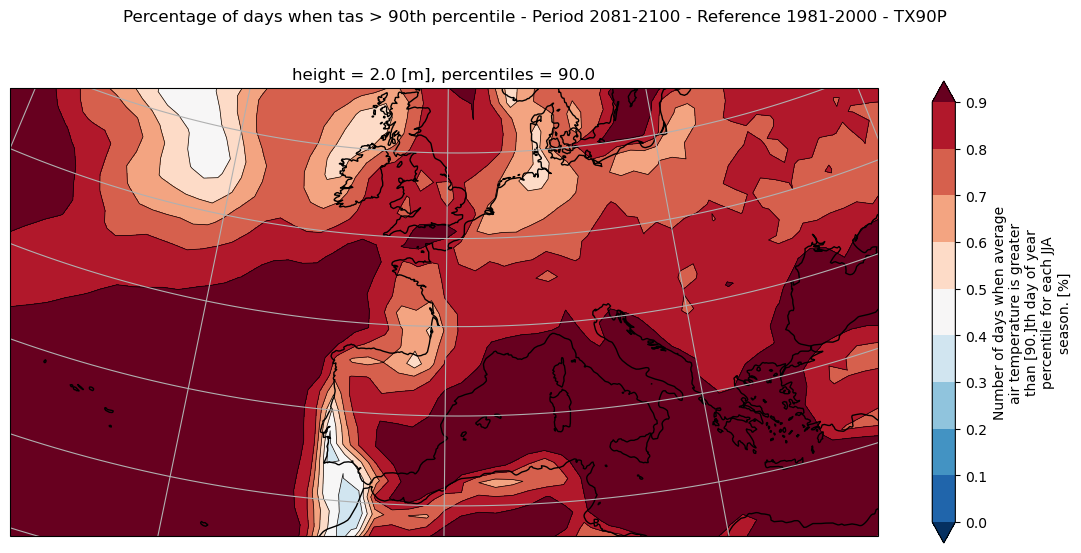
[14]:
# Re-order longitude so that there is no blank line at 0 deg because 0 deg is within our spatial selection
tg90_avg.coords["lon"] = (tg90_avg.coords["lon"] + 180) % 360 - 180
tg90_avg = tg90_avg.sortby(tg90_avg.lon)

# Define plot
f, ax = plt.subplots(figsize=(14, 6), subplot_kw={"projection": map_proj})

# Define colorscale
levels = np.arange(0, 1.0, 0.1)

# Contours lines
p = tg90_avg.plot.contour(
    levels=levels, colors="k", linewidths=0.5, transform=ccrs.PlateCarree()
)

# Contour filled colors
p = tg90_avg.plot.contourf(
    levels=levels, cmap="RdBu_r", extend="both", transform=ccrs.PlateCarree()
)

# Plot information
plt.suptitle(
    "Percentage of days when tas > 90th percentile - Period 2081-2100 - Reference 1981-2000 - TG90P",
    y=1,
)

# Add the coastlines to axis and set extent
ax.coastlines()
ax.gridlines()
ax.set_extent(extent)

# Save plot as png
plt.savefig("c4i_tg90p_contours_icclim.png")